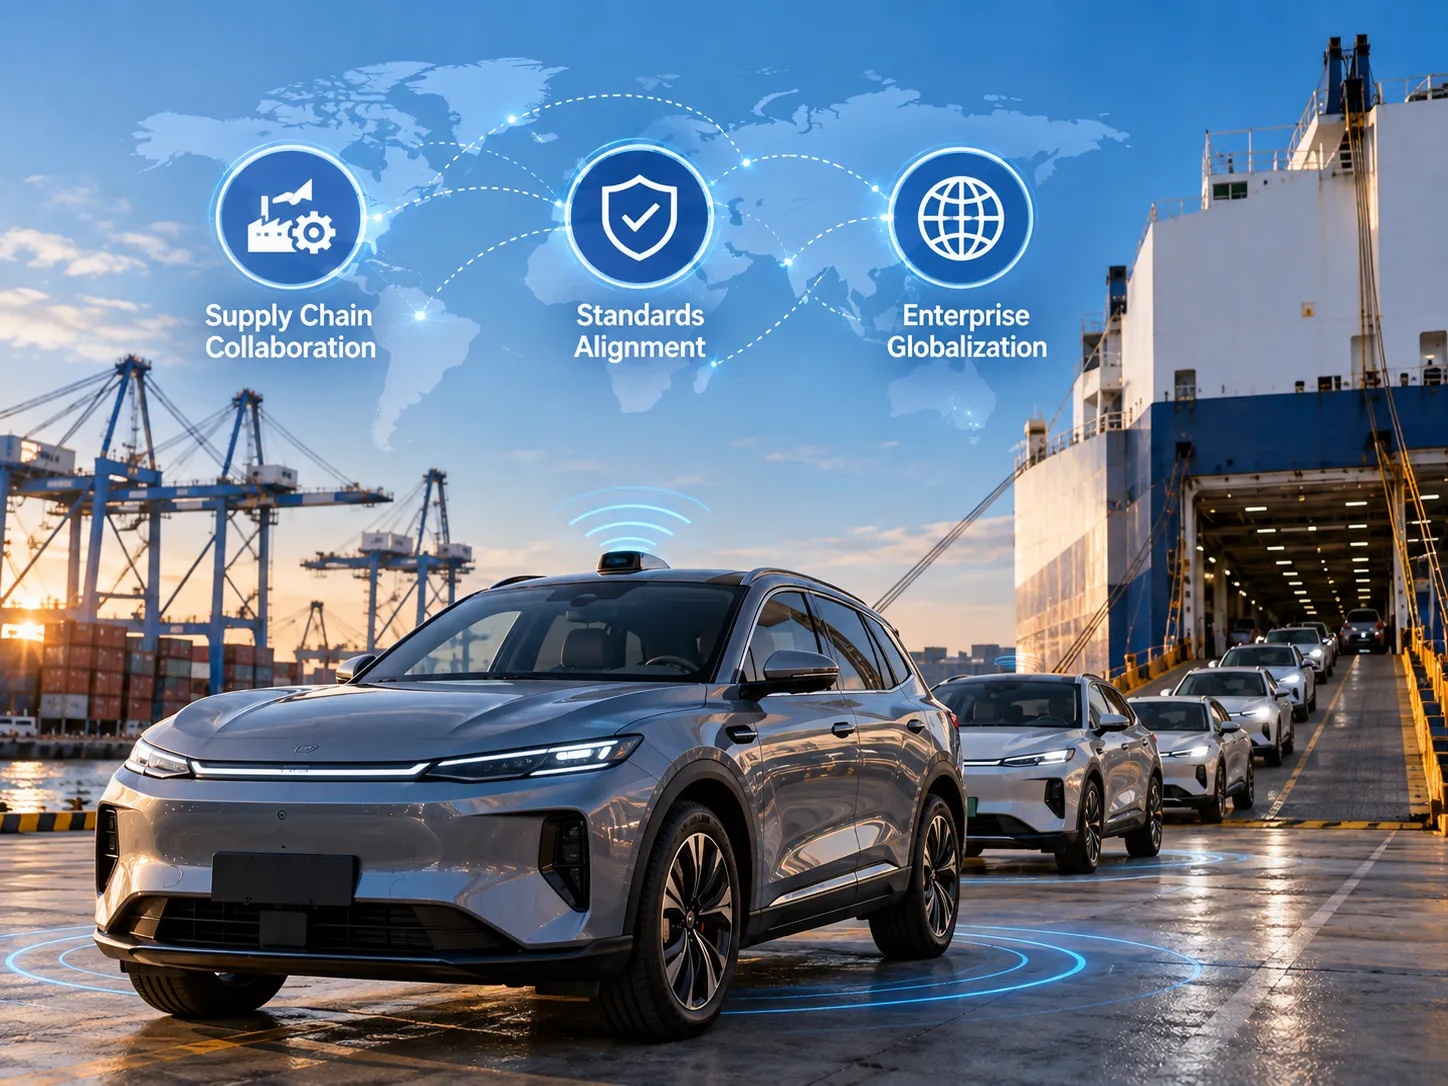
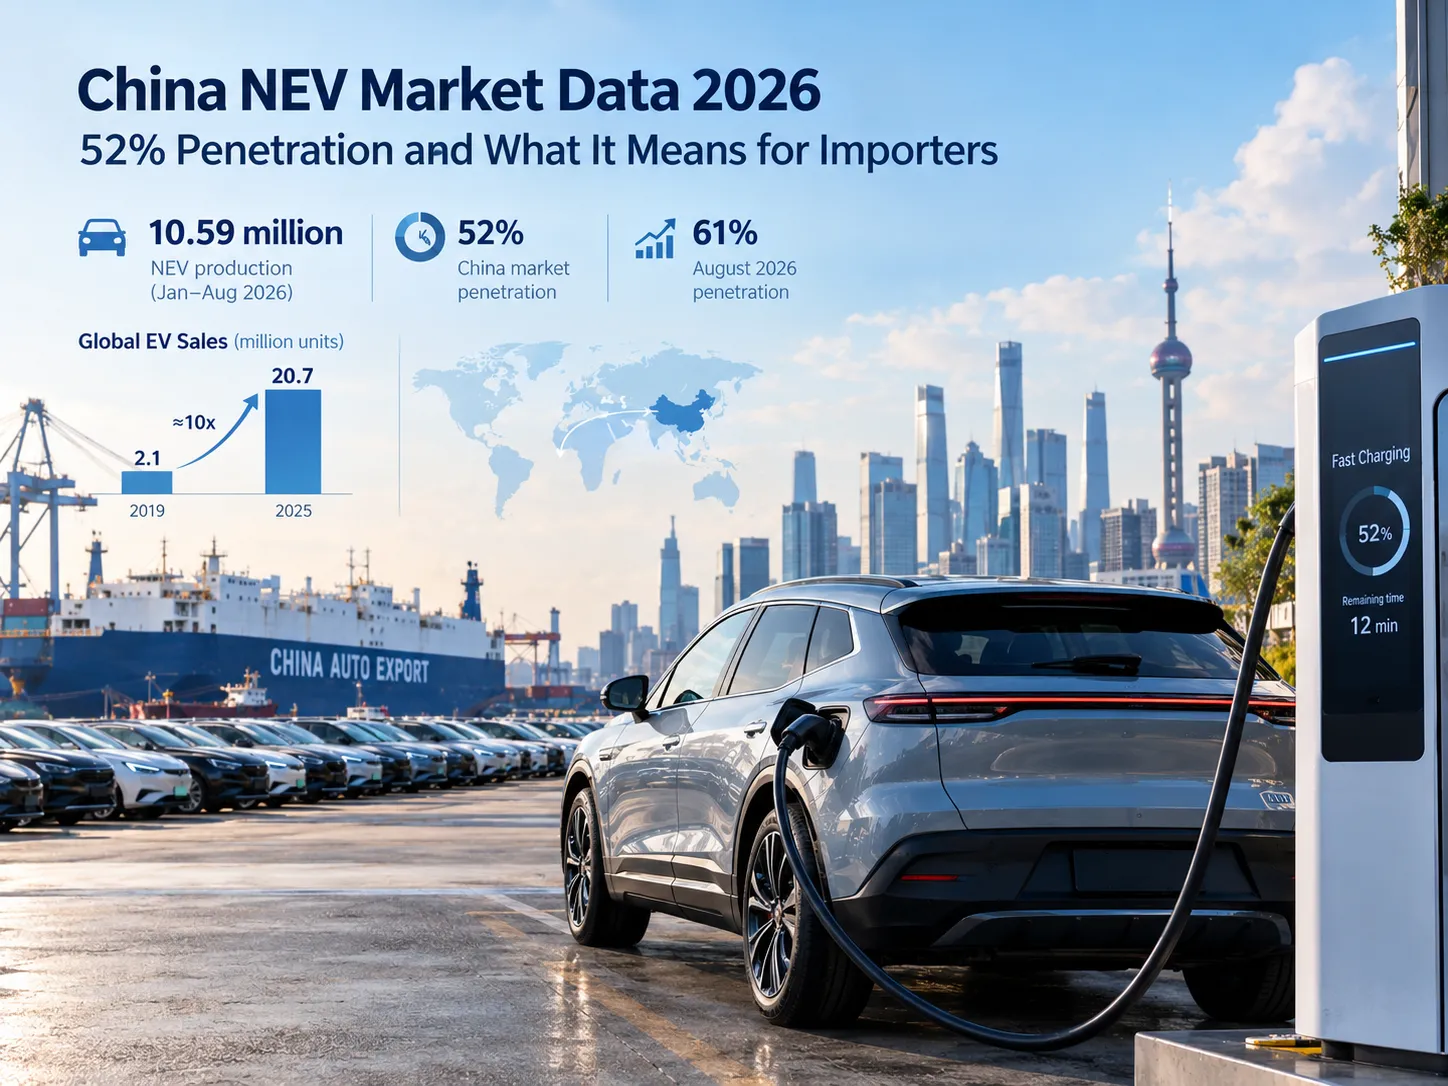
China's new energy vehicle production reached 10.59 million units in January–August 2026, a 52% penetration rate that hit 61% in August alone. Global EV sales jumped from 2.1 million in 2019 to 20.7 million in 2025. Here is the data importers and wholesalers need before placing a 2026 order.
The Six-Year Jump: 2.6% to 24% Global Penetration
Six years ago, new energy vehicles were a rounding error in most markets. In 2019, the world sold 2.1 million of them, for a 2.6% penetration rate. By 2025, that figure reached 20.7 million units and 24% — roughly a tenfold increase, as Zhu Huarong, Chairman of Changan Automobile and President of the World New Energy Vehicle Development Organization (WNEVDO), laid out at the 2026 World New Energy Vehicle Congress (IEA Global EV Outlook tracks the same trajectory). More than 100 countries posted meaningful growth, and the sector now qualifies as a trillion-level strategic industry in its own right.
What this means in practice: the market you import into has likely already crossed an adoption inflection point. We watched it happen in real time. A distributor we worked with in Southeast Asia ignored EVs for years, telling us his customers only wanted combustion pickups. He placed his first mixed container in 2024. By mid-2026, electric models were his fastest-turning stock. The tenfold curve is not a chart in a slide deck — it is buyers changing what they order.
The drivers behind the curve matter for your sourcing decisions. WNEVDO's data shows the global fleet now saves roughly 1.7 million barrels of oil per day, projected to reach 5 million by 2030. That dependency shift is why so many governments keep the policy taps open — and why homologation and tariff regimes for Chinese EVs keep evolving, for better and worse, in almost every region at once.
China in 2026: 52% Penetration, 61% in August
The Chinese market is where the global number gets real. In the first eight months of 2026, China produced 10.59 million new energy vehicles, up 11% year on year (China Association of Automobile Manufacturers). Penetration reached 52% for the period — and 61% in August alone. Meanwhile, internal-combustion output fell 15% to 9.72 million units.
Read that carefully. One in every two vehicles rolling off a Chinese line is now electric or a plug-in hybrid. That ratio reshapes everything downstream — parts availability, service training, residual values, and the wholesale price points you negotiate from. A fleet buyer in Chile put it bluntly when we quoted him last quarter: "If half of China's factories are building EVs, the ICE models I've always imported are the ones about to get expensive to maintain."
The scale threshold has shifted too. Zhu's assessment at the congress was blunt: in three to five years, 3 million units of annual volume may only be enough to survive, 5–7 million to do well, and 8–10 million to genuinely thrive. The industry is consolidating fast, with the global top ten projected to hold 80% share by 2030. For an importer, that is a supplier-risk warning disguised as a market statistic: the brands you anchor on now should be the ones with the volume runway to still be here in five years.
The Margin Squeeze: Why Your Wholesale Prices Are Under Pressure
Here's the part most exporter write-ups skip: Chinese automakers are getting squeezed, and that pressure flows straight into the prices you pay. China Passenger Car Association (CPCA) data, presented by secretary-general Cui Dongshu, shows the industry earned ¥253.4 billion in profit over the first eight months of 2026 — down 16% year on year. The sales margin fell to 3.6%, down from 4.1% in 2025 and 4.3% in 2024.
The per-vehicle economics tell the story in numbers an importer can feel. Chain-wide, each vehicle generated about ¥345,000 in revenue but only ¥12,000 (roughly US$1,650) in gross profit, down 5.1%. Rising memory chips, lithium carbonate, non-ferrous metals and semiconductors are eating into costs while a brutal domestic price war holds down selling prices. That is "revenue up, profit down" at industry scale — and it is why some OEMs are quietly pushing volume into export channels at prices that would have been unthinkable two years ago.
The reality is, this is a double-edged sword for buyers. Lower factory margins can mean better ex-works pricing on the vehicles you import. It can also mean thinner aftersales support budgets and more aggressive cost-cutting in components you never see until a warranty claim lands. When we negotiate for clients, we now ask for the full-cost breakdown on anything below an OEM's list, because a price too far under market usually has a reason hiding somewhere in the supply chain.
Charging as Fast as Refueling: The Last Barrier Falls
The single most common objection we hear from overseas fleet buyers is charging time. Lian Yubo, BYD's Chief Scientist and head of its Automotive Engineering Research Institute, told the same congress that the industry is now attacking exactly that problem — calling it the "last barrier" to full electrification.
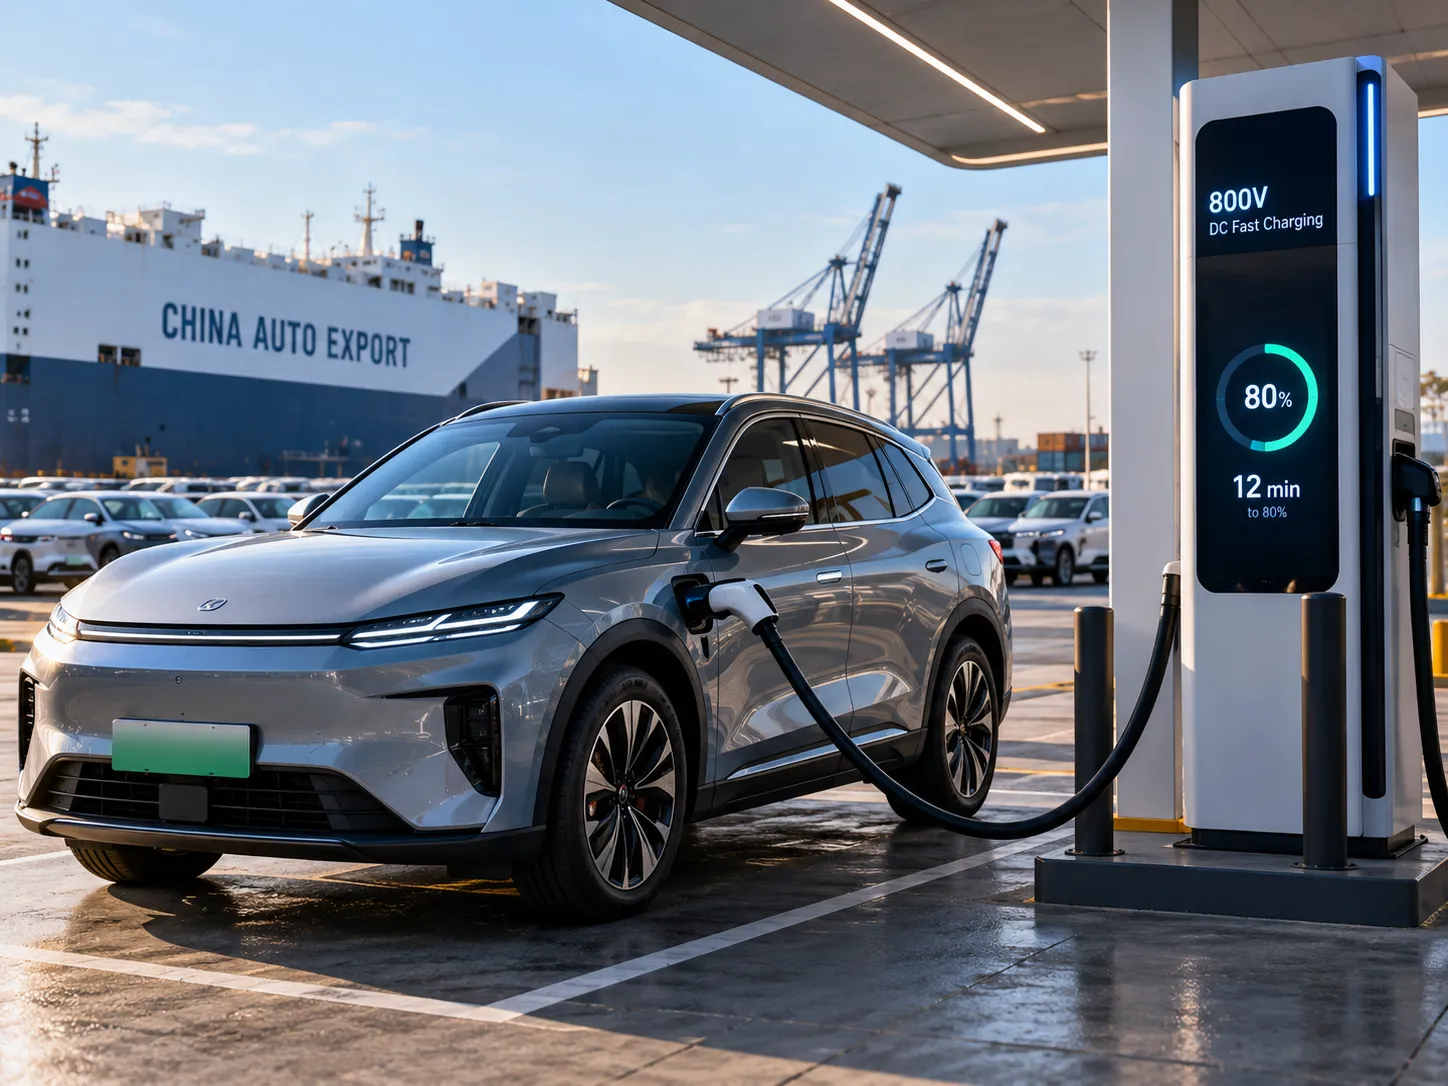
The numbers are striking. BYD's second-generation Blade Battery, paired with a 1,000-volt architecture and a liquid-cooled charger capable of 1,500 kW per gun, can take a 1,000 km-range EV from empty to 97% in nine minutes. In minus-30°C conditions, it adds at most three minutes. BYD has built over 10,000 flash-charging stations in China and plans 90,000 within two years — roughly the number of gas stations in the country — before rolling the network out globally from early next year.
Why 97% and not 100%? Lian's team deliberately leaves a sliver for regenerative recovery to avoid wasted energy. That kind of detail matters to an importer because it changes the pitch you make to your own buyers. A depot operator we supply in the Middle East replaced two diesel vans with electric cargo models last year specifically because a nine-minute charge fit his shift schedule. The objection collapsed once the refueling comparison became literal.
BEV vs PHEV: Which Powertrain for Your Market
For all the headlines, the smart money is not betting on a single technology. WNEVDO's first-half 2026 data shows "broad" new energy at 31% of global share — pure electric at 16%, plug-in hybrids and range-extenders at 15% combined — while internal-combustion and conventional hybrids still account for 69%. Ten to fifteen years out, no single route will win everywhere, and "multi-powertrain parallel" is the realistic playbook.
That is a sourcing insight, not a caveat. If your market has weak charging infrastructure or a cold climate, a PHEV or range-extender from a Chinese supplier may clear customs and sell faster than a pure EV. If you serve dense urban fleets in a warm region, a pure EV wins on total cost of ownership. The exporter who lets you pick by your local conditions — rather than pushing whatever they have in inventory — is the one protecting your margin, not theirs.
What This Means for Importers, Wholesalers and Fleet Buyers
Strip away the conference rhetoric and the 2026 China NEV data reduces to four decisions for a buyer.
First, supplier selection. The 80%-by-2030 consolidation projection means you should anchor on OEMs with real volume and export staying power, not price alone. Ask for production data, export-region coverage and warranty-claims history — the same way you would underwrite any long-term partner.
Second, timing. Margins are compressed now, which tends to favor the buyer who can move volume quickly while the price war lasts. The window will not stay open forever once consolidation finishes.
Third, powertrain fit. Match BEV, PHEV or range-extender to your local grid, climate and driving patterns rather than chasing the loudest global trend.
Fourth, aftersales. A 3.6% industry margin is a reminder to lock in parts, service training and warranty terms in the same contract as the vehicles — because that is where cheap deals tend to unravel.
None of this is hard to verify, but it is easy to get wrong from a spec sheet alone. The exporters who will serve you well in 2026 are the ones who can hand you this data and stand behind the vehicles it describes.
Frequently Asked Questions
What is China's NEV penetration rate in 2026?
China's new energy vehicle penetration reached 52% for January–August 2026, with August alone hitting 61%. In the same period, NEV production totaled 10.59 million units, up 11% year on year, according to CAAM data.
How much profit are Chinese automakers actually making?
Not much, on a per-vehicle basis. The industry's first-eight-month profit was ¥253.4 billion, down 16%, at a 3.6% sales margin — roughly ¥12,000 of gross profit per vehicle after costs. That compression is one reason export pricing can look aggressive right now.
Can I import Chinese electric cars into my country?
In most markets, yes — subject to local homologation, safety and emissions-equivalent certification. The process varies widely by region, which is why working with a vehicles exporter that has cleared your specific market before shortens the timeline significantly. We handle the documentation, port logistics and compliance for each destination we serve.
Is BYD's fast charging really as fast as refueling?
For its flagship 1,000 km-range models, BYD quotes nine minutes to 97% on a 1,500 kW flash charger, with only a few minutes of penalty in extreme cold. The charging network to support it is scaling fast in China and expanding globally from 2027.
Should I import BEV or PHEV models?
That depends on your market's charging infrastructure, climate and driving patterns. Pure electric still holds a modest global share lead, but plug-in hybrids and range-extenders together nearly match it, and combustion-plus-hybrid still dominates overall. The right answer is the powertrain your buyers can actually charge and service.
How do I source China NEVs at wholesale prices?
Start with a China auto exporter that can provide production and pricing data, confirm your market's homologation path, and quote real ex-works and landed costs. If you'd like a tailored quote for your region, our team at Zacarmate can walk you through the process — see below.
Sources
International Energy Agency, Global EV Outlook 2025 — global EV sales and penetration trends. iea.org
China Association of Automobile Manufacturers (CAAM) — China NEV production and penetration data, January–August 2026. caam.org.cn
China Passenger Car Association (CPCA), Cui Dongshu — industry profit, margin and per-vehicle economic indicators, January–August 2026. cpcaauto.com
World New Energy Vehicle Development Organization (WNEVDO) / 2026 WNEVC — Zhu Huarong keynote on global penetration, consolidation and charging infrastructure.
About Zacarmate
Zacarmate is a China-based auto exporter supplying overseas dealers, wholesalers and fleet buyers. We source new energy and combustion vehicles directly from major Chinese manufacturers, then handle export documentation, homologation support, freight and port logistics door-to-port or door-to-door.
Quality commitment: factory-direct sourcing with pre-shipment inspection and full documentation on every unit.
MOQ: from 1 unit for trial orders; volume pricing from 10+ units.
Logistics coverage: shipping to Southeast Asia, the Middle East, Africa, Latin America, Central Asia and select European markets.
Contact: [Insert company email / WhatsApp / website] — mention your destination market for a tailored quote.
Looking for a reliable China auto exporter? Get a tailored quote backed by the 2026 market data above — contact the Zacarmate team today.
Zhongan TikTech (Anhui) Co., Ltd.
Zhongan TikTech (Anhui) Co., Ltd., a Conch Group SOE, exports quality new & used vehicles globally with 40+ years' foreign trade expertise.
 EN
EN
 fr
fr  es
es  ru
ru  pt
pt